Map Explorer
The Map Explorer allows you to visually explore scenario data with the aid of a map projection. With this tool, it is possible to:
view data according to their original geographical resolution
view data in aggregated form, calculated from the original resolution
compare data across regions with choropleth mapping
understand variable evolution over time with timeline progression
The Map Explorer can be broken down into four main components:
the data selection toolbar, located in the top section of the page
the map visualization, employing Natural Earth or Equal Earth datasets
the timeline progression, located in the bottom left corner of the page
the choropleth legend, located in the bottom right corner of the page
Data Selection
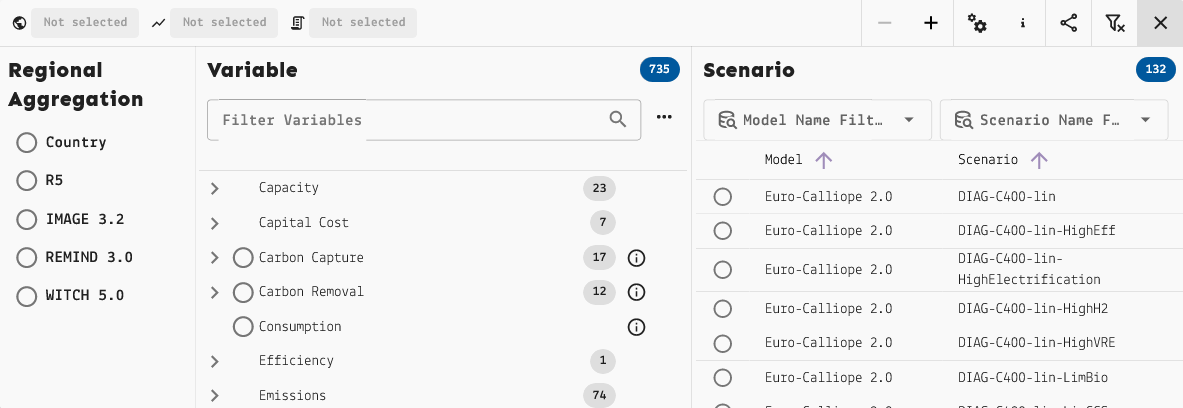
The Map Explorer data selection toolbar.
The data selection toolbar expands to reveal a three-part menu where you select
one  region aggregation, one
 variable, and one
 scenario.
Available selections are updated when each data filter is selected to only include
combinations for which data is available.
A reminder message will be displayed on top of the map view while the selection
is incomplete.
Unlike the Data Explorer, this interface doesn’t select specific regions; instead, you can select the region aggregation to apply to the world map. These can be standard territories, like countries or continents, or model-specific region definitions.
On the right section of the toolbar, there are the following buttons:

 -/+ to zoom the map in/out
 Visualization Settings to select number of data classes, color scheme,
and color for missing values
 About this Map to read more information on the geodata used for the
Map Explorer
 Share Map to copy the link to the current map view (and data selection)
to share with other users with access to the Scenario App
 Clear Selection and Filters to reset the map to a blank slate
Tip
To learn more about region definitions, see Native and common regions. To learn more about region aggregation, see Region processing using model mappings.
Map Visualization
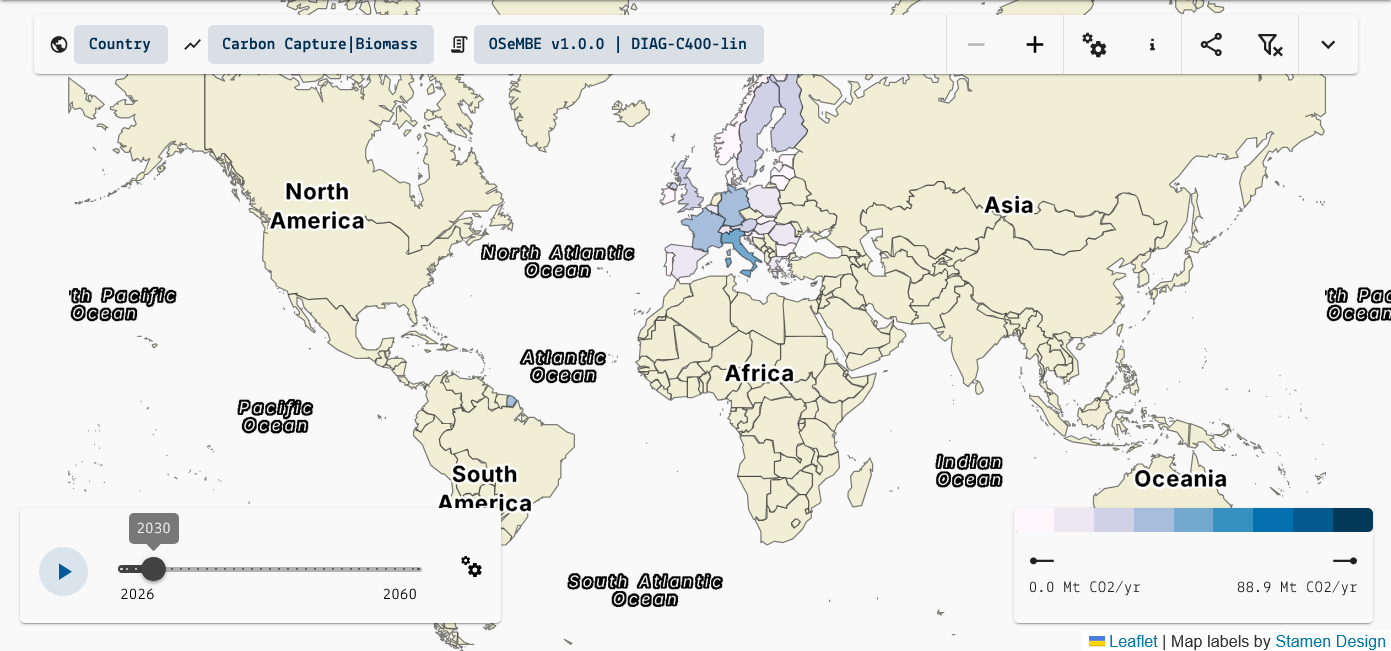
The Map Explorer data selection toolbar.
The map supports zooming out for a view of the entire world, and zooming in down to a generally subnational scale.
Clicking on a region will pan the map to it and open up a detailed data chart at the bottom of the page. In the detailed chart view, it’s possible to show/hide specific time series, download the chart image and/or data, and toggle between seeing only the region data and comparing with other regions. Hovering over a data point reveals all the information pertaining to it.
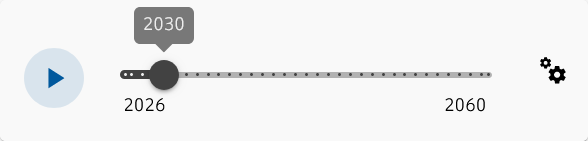
Timeline slider.
The timeline slider can be moved manually or set to play automatically.
It will show the evolution of the chosen variable over time.
The Slider settings allows changing the speed of the animation.
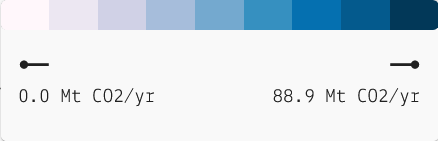
Choropleth legend.
The choropleth legend shows the color scheme assigned to the map. Hovering over each color will reveal the interval of values it represents.